Home / QualityPulse
Current productQuality intelligence for multi-site manufacturers.
One trusted view of quality performance across every plant, without replacing your ERP. QualityPulse brings scorecards, corrective actions, complaints and market returns into one place your quality meeting can rely on.
Case story · a multi-plant manufacturing quality team
From a 30-page weekly deck to one live view.
Every week, this team rebuilt the same report by hand from spreadsheets and outside dashboards. QualityPulse now brings those sources together. The team presents straight from it, so the week starts with answers instead of assembly.
Before The weekly scramble
- Data lived in Excel and Google Sheets, across several sources, each structured differently.
- Outside dashboards were used alongside them, and the team waited on external sources for numbers.
- Figures were copied by hand into a PowerPoint of more than 30 pages, every week.
- It took a full working day or more every week, and longer when external sources were late.
After One live view
- Every source is mapped into one consistent structure, built around the team’s own report definitions.
- Weekly preparation fell from a full working day or more to about 30–45 minutes of data entry, the one manual step left.
- The team presents from the app itself. The PowerPoint is gone.
- Plant reviews run on it, some plants have their own controlled access, and when the MD, COO and other executives visit, they present the facts from it.
How we got there
Listen first
We learned how the team really reported: where each number came from, in what format, and how the weekly meeting used it.
Map every source
Each source’s report structure was mapped to one consistent model, using the team’s own scoring definitions and targets.
Live in under three weeks
Live within three weeks of the first conversation, and fully tuned to the team’s reports within five. The views follow the weekly review the team already runs.
Even with manufacturing experience, the first job was to understand how this team’s reports actually worked, source by source. Only then did we build anything.
Run a weekly report like this one?
Tell us where your numbers live today. We will show you what the same view would look like for your plants.
Figures reported by the client’s quality team, from one multi-plant deployment. Timelines and savings depend on how many sources you have and how clean they are. Client name withheld at their request. The sample screens on this page use fictional data.
The Monday quality report, already done.
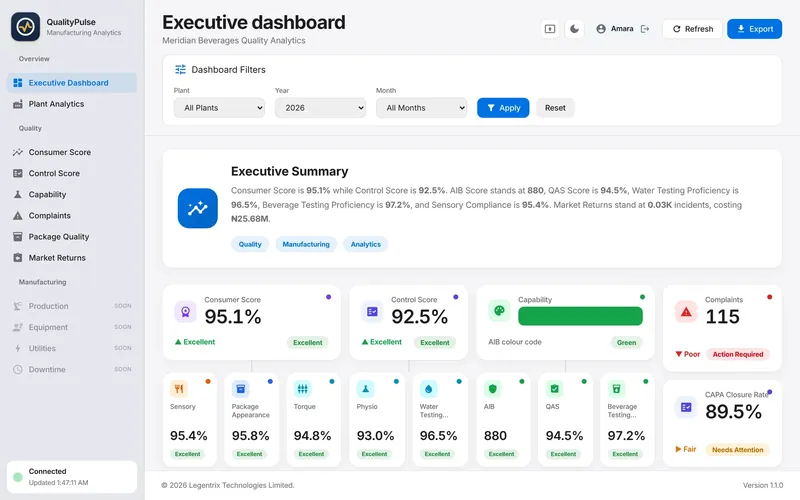
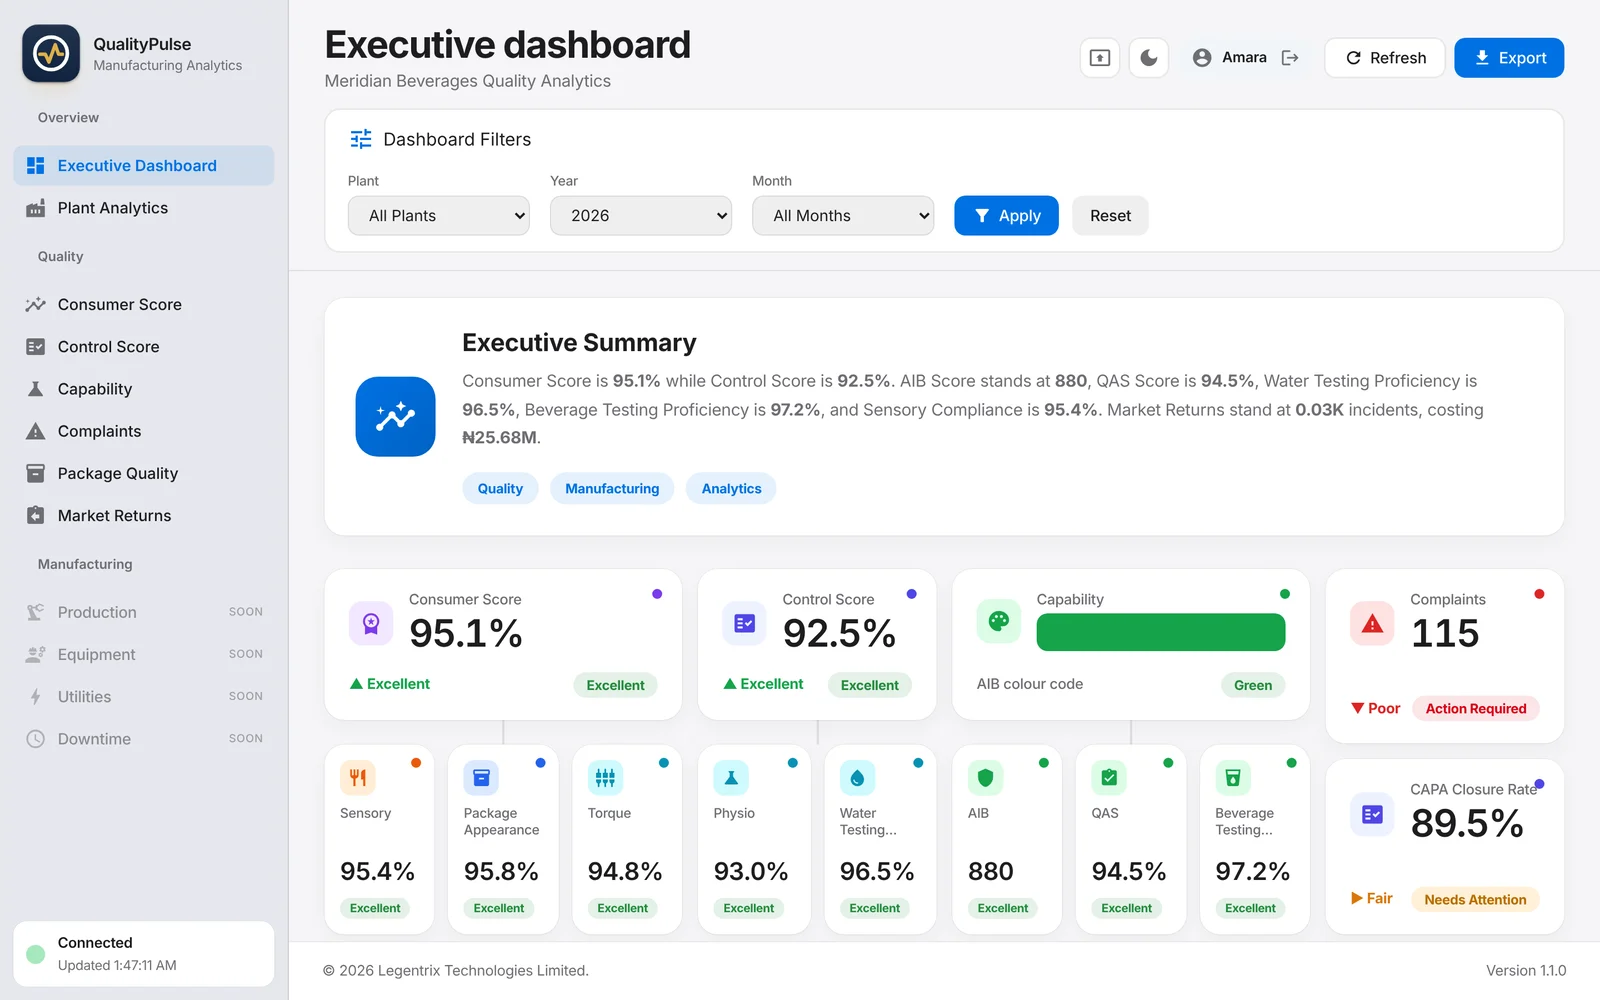
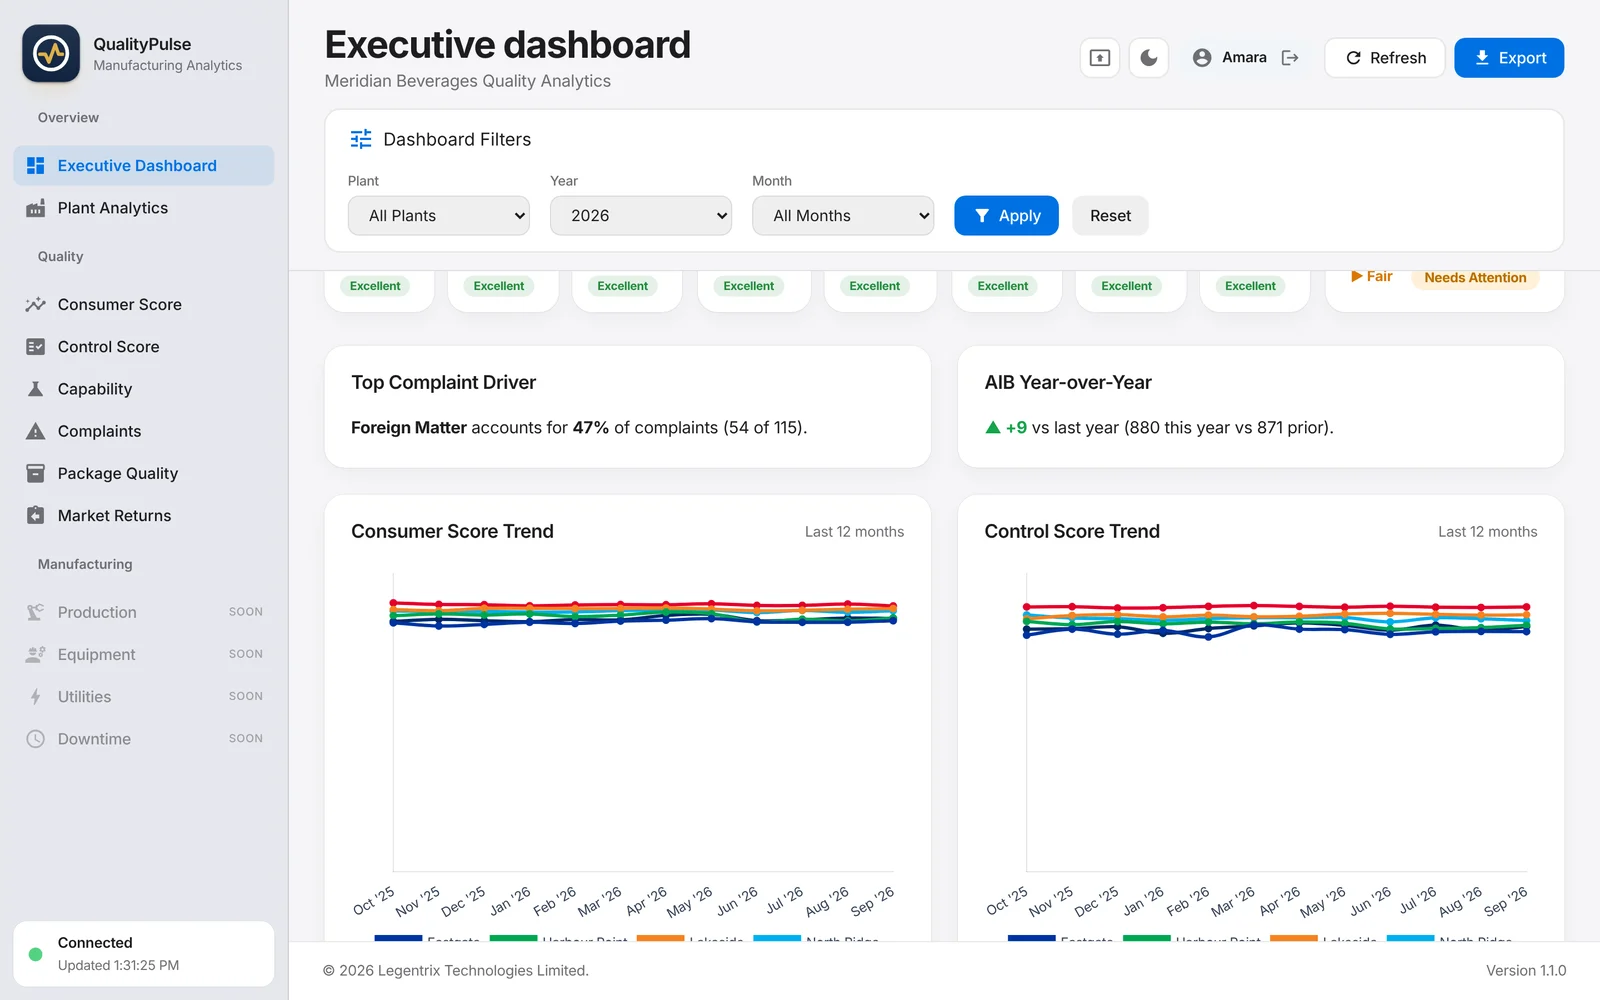
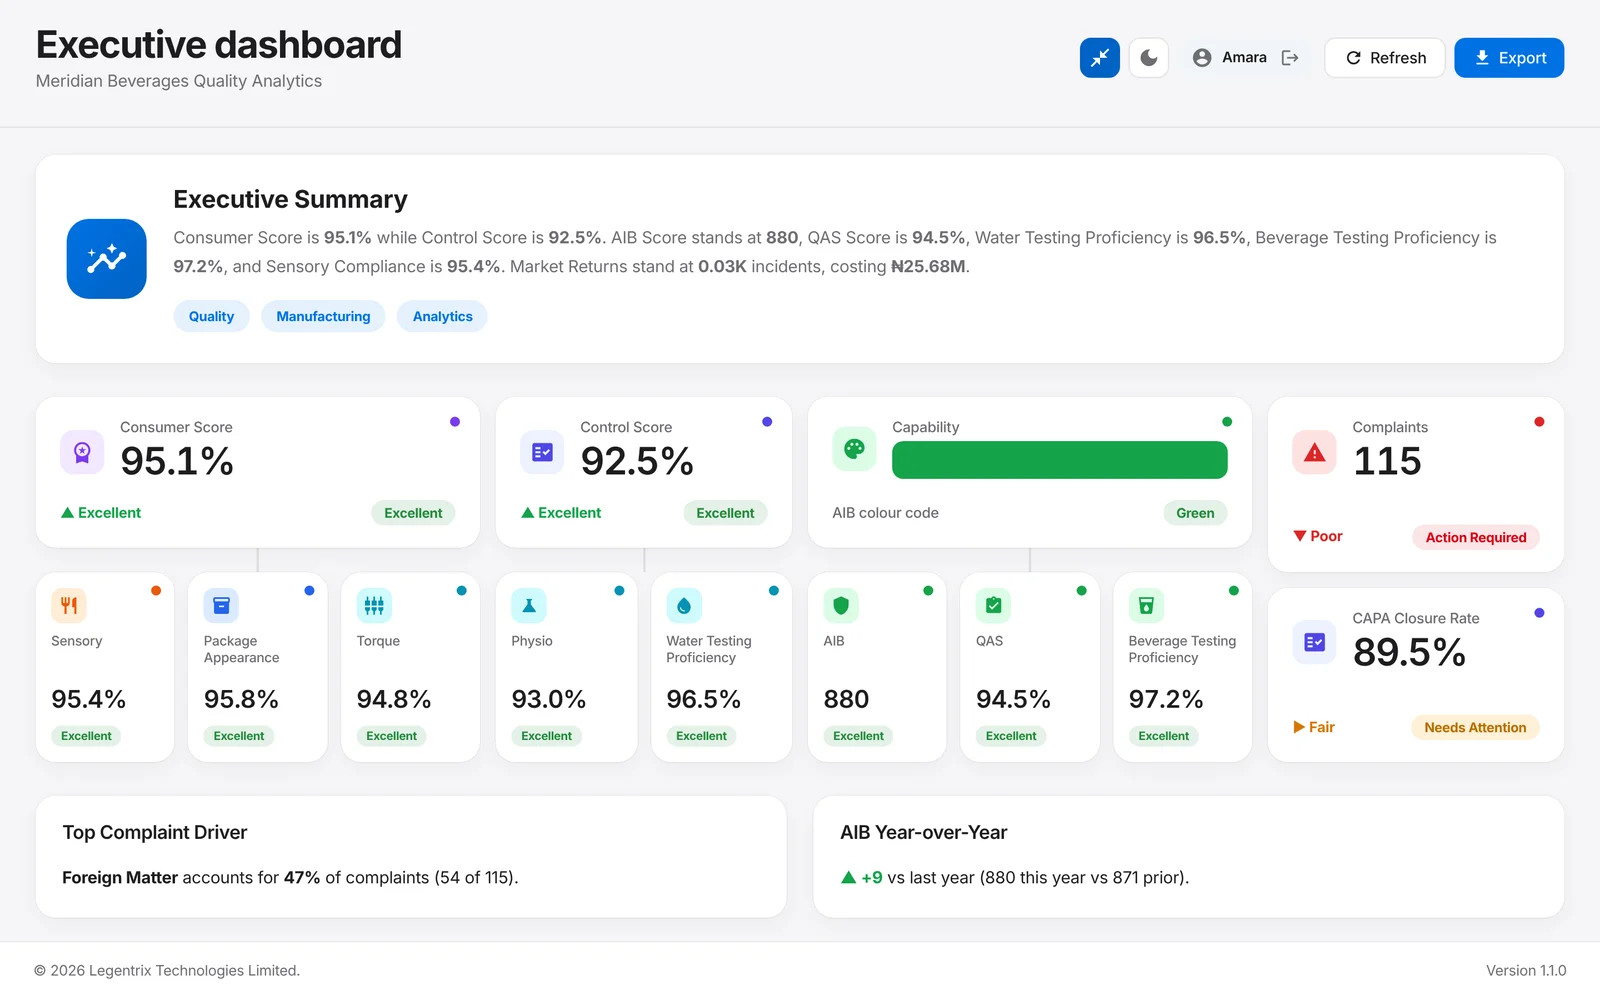
The executive summary shows every plant against target, with the corrective actions and complaints behind each number one click away.
A 75-second tour of the real application running on sample data for a fictional beverage group. Real figures, plant names and users stay private to each client. On a phone or a slow connection the tour loads a lighter copy.
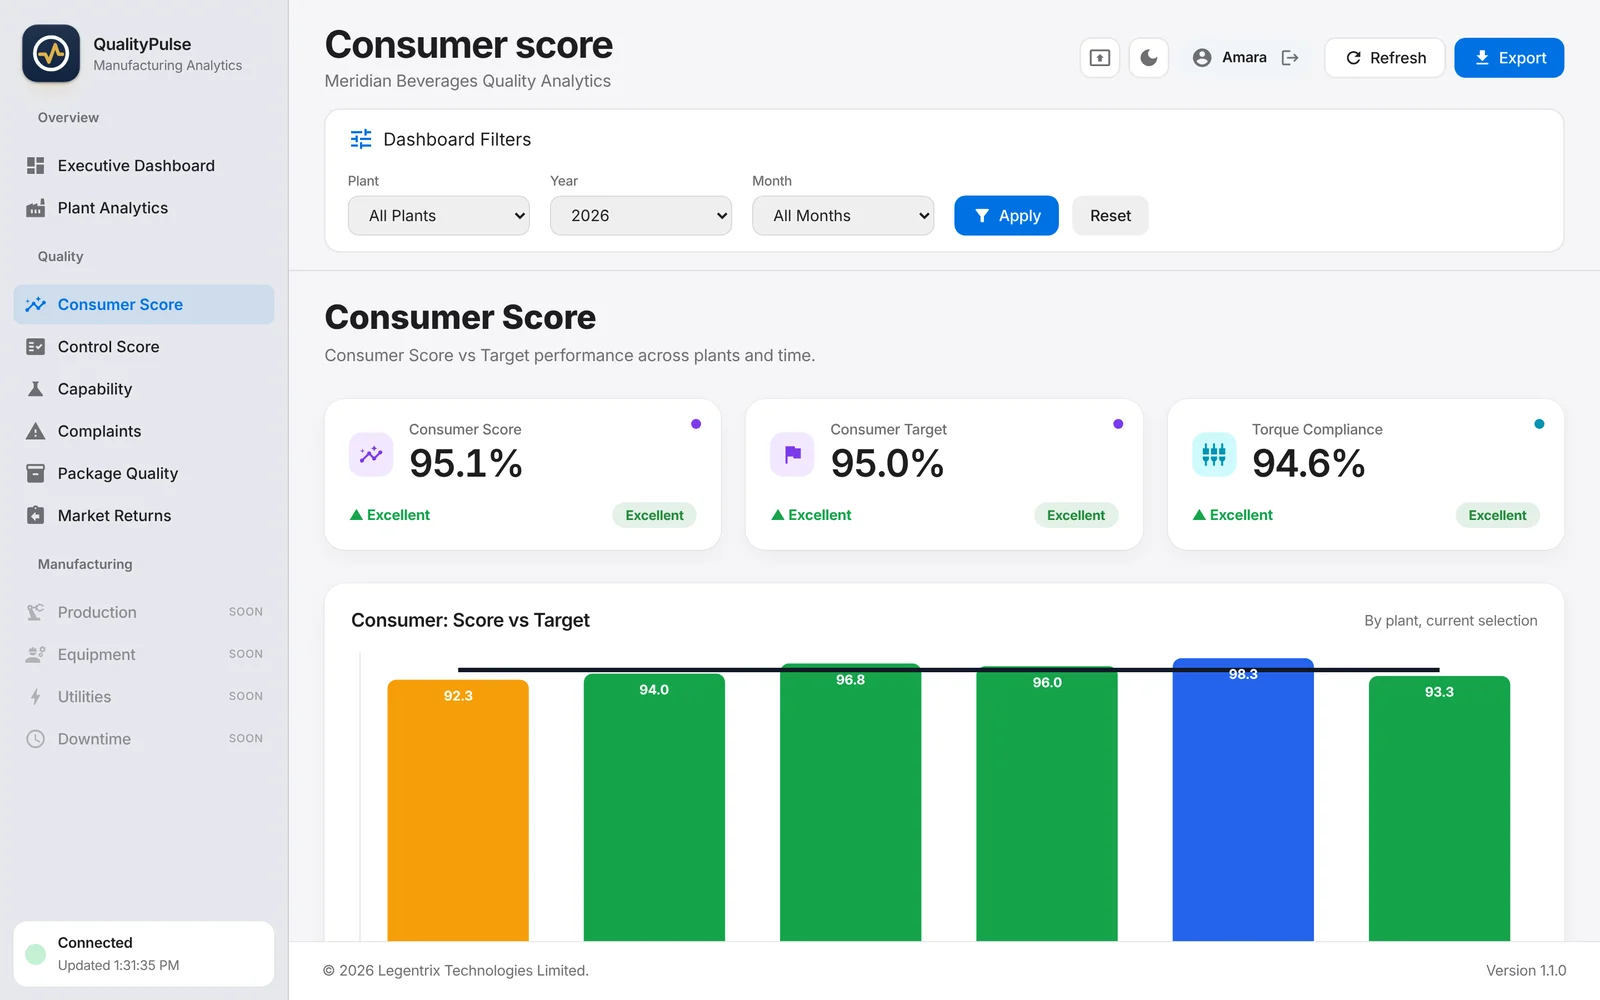
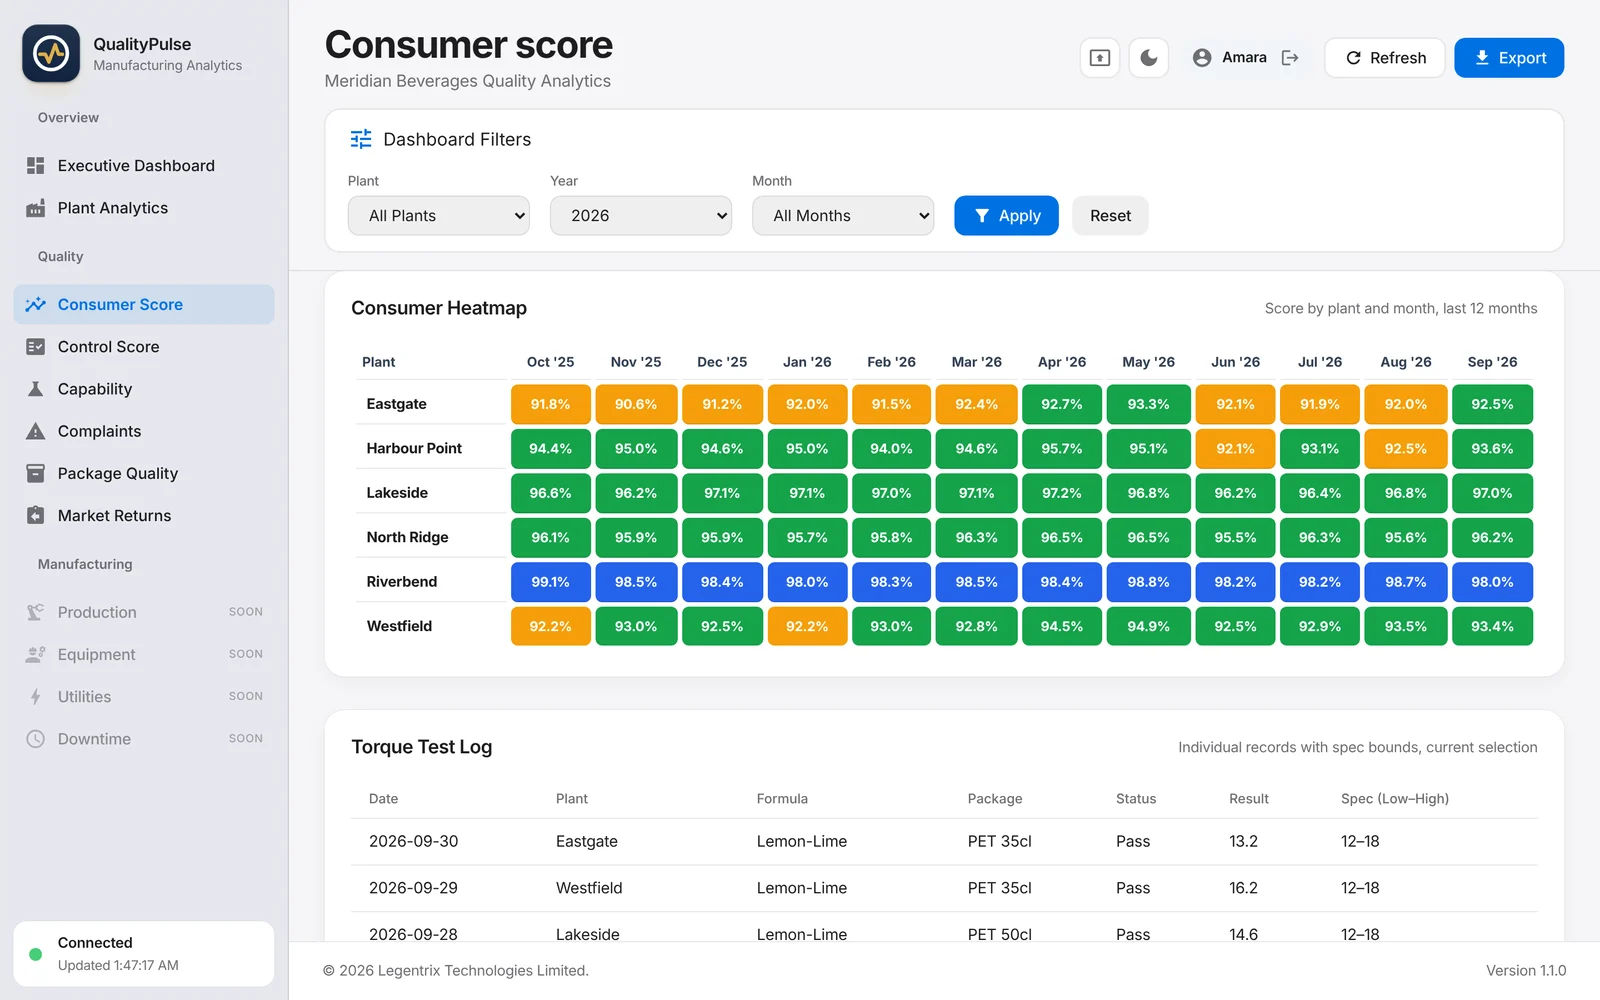
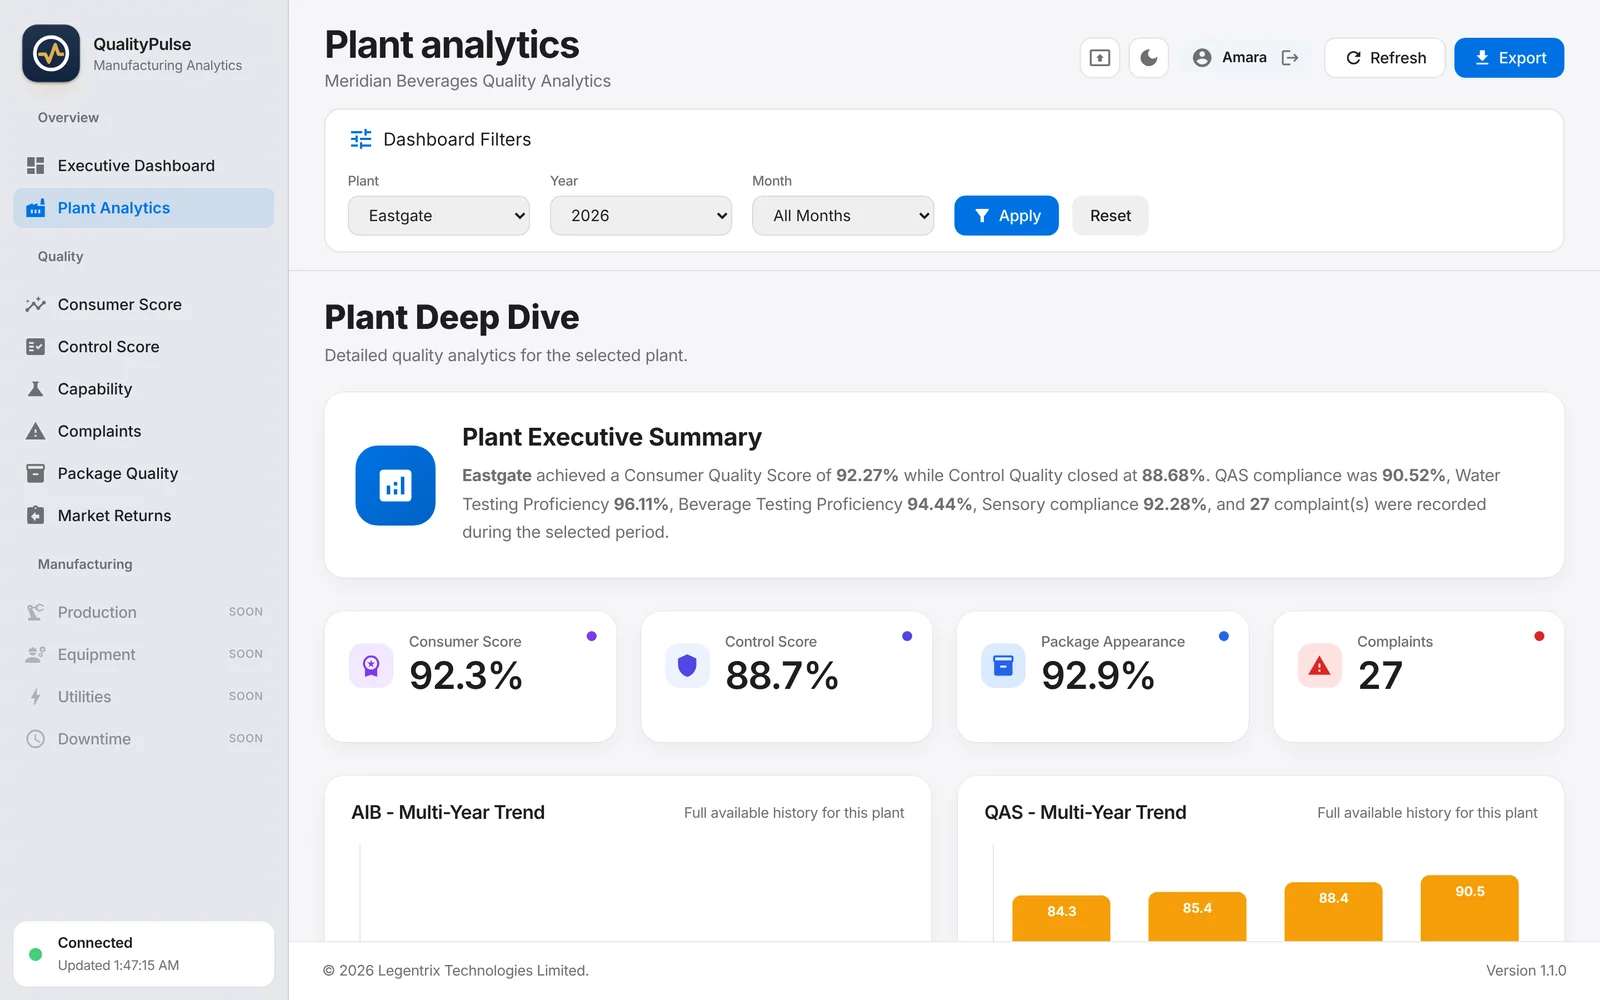
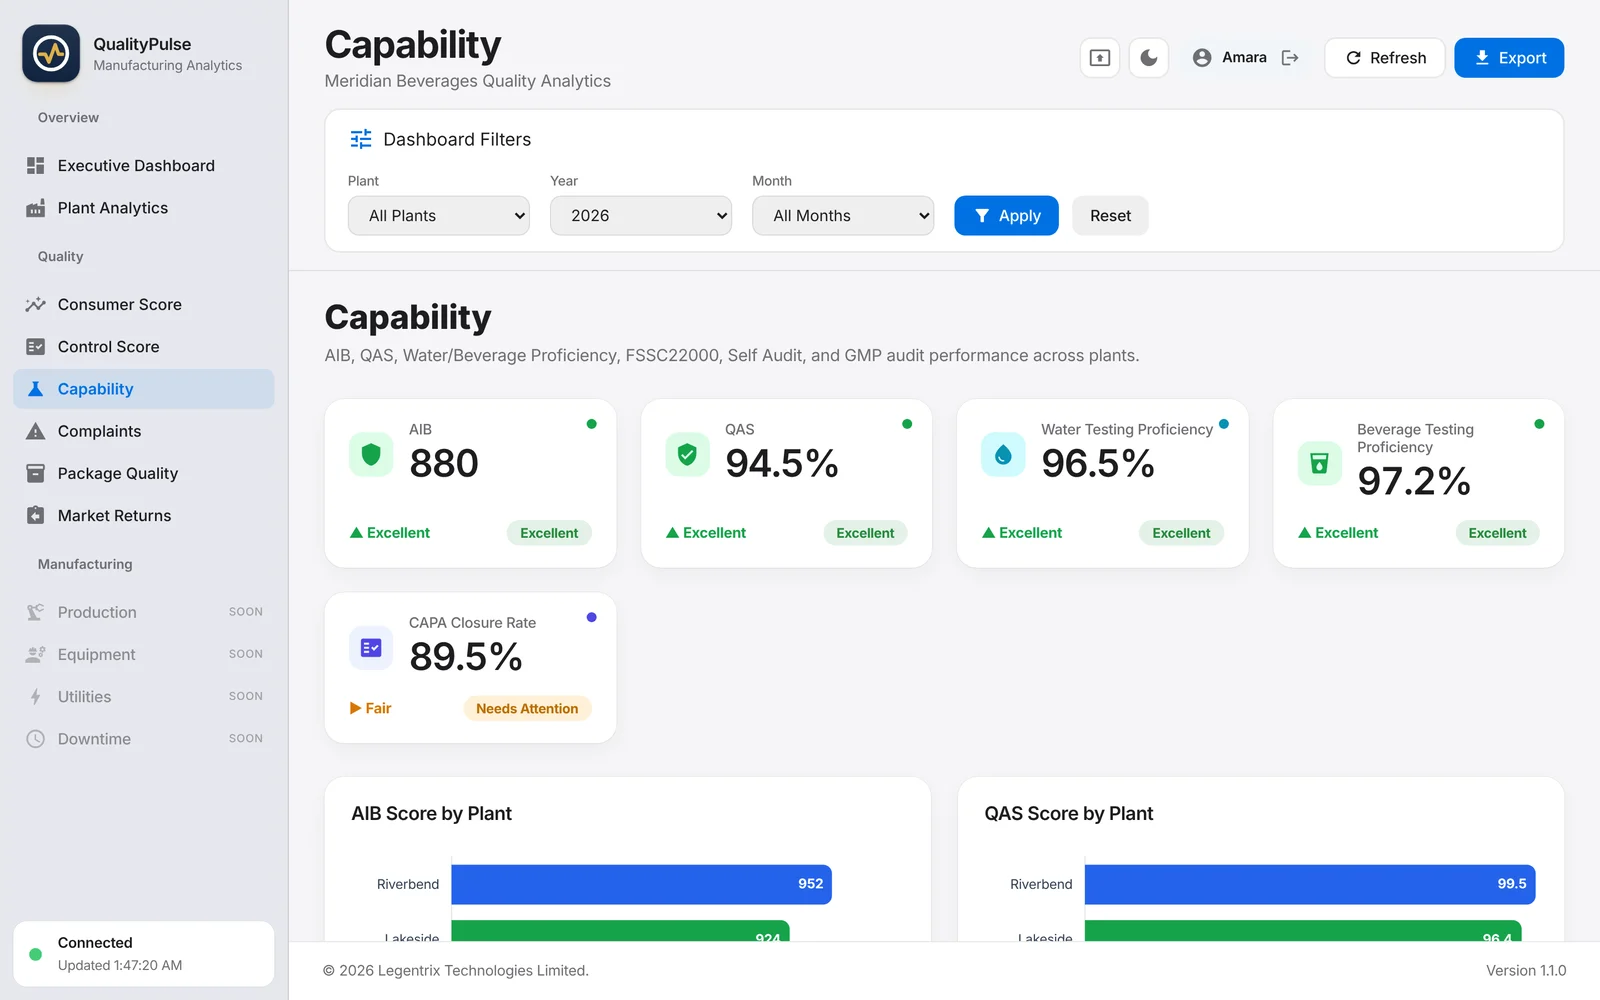
Every panel, on sample data.
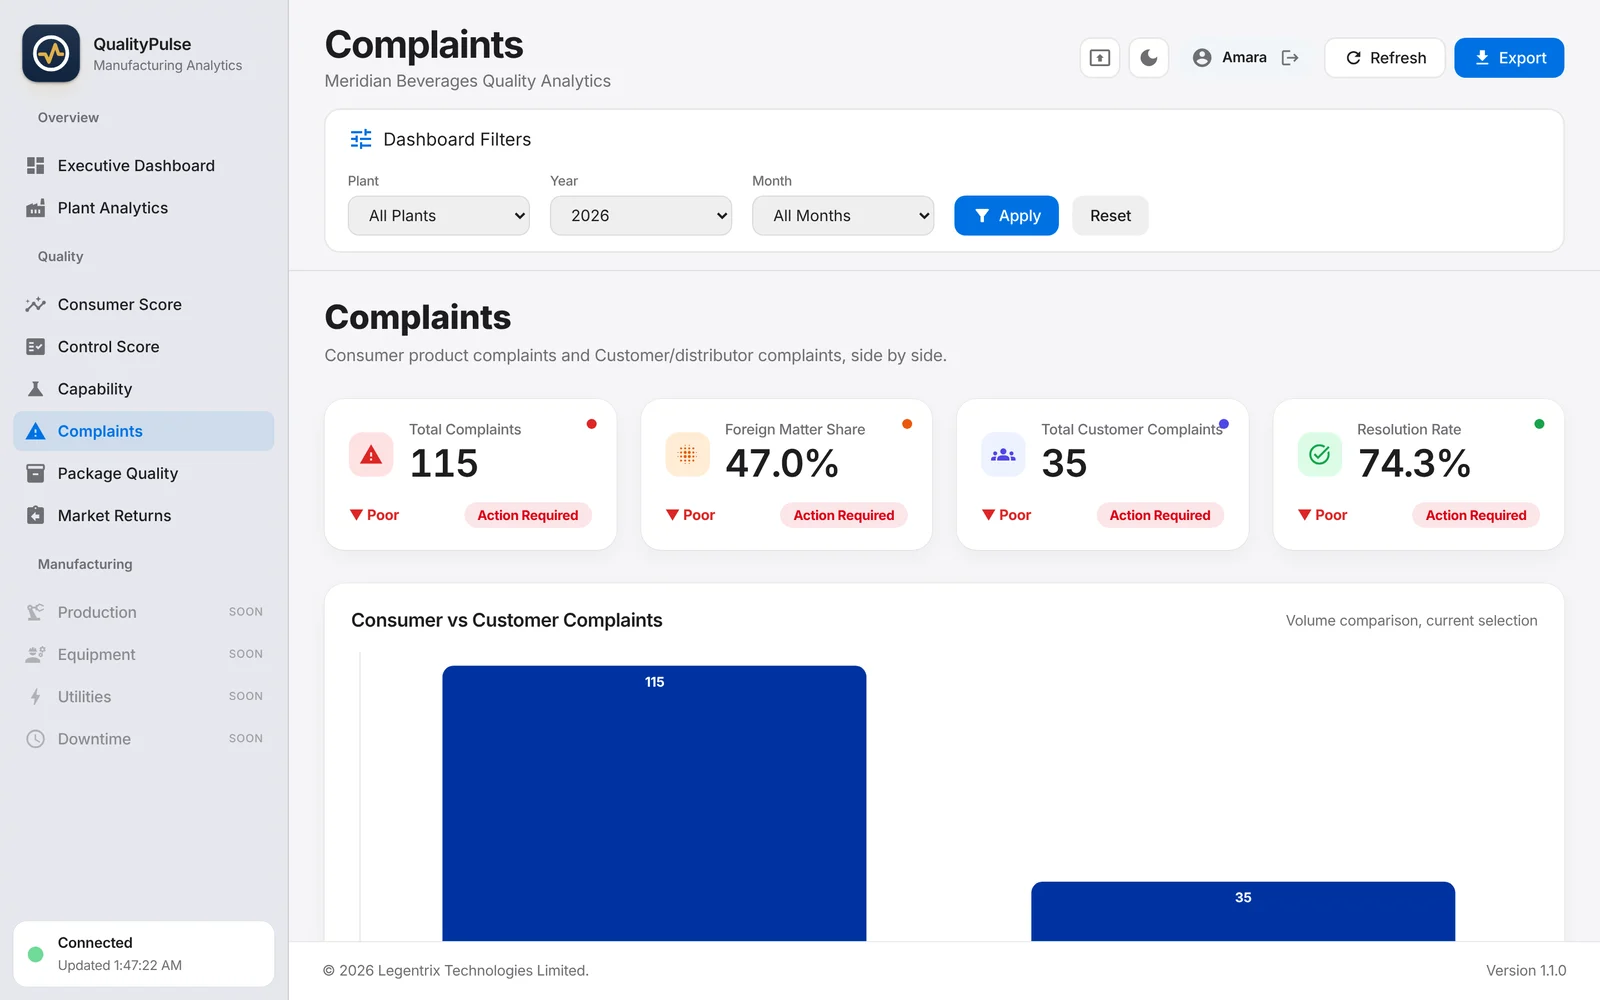
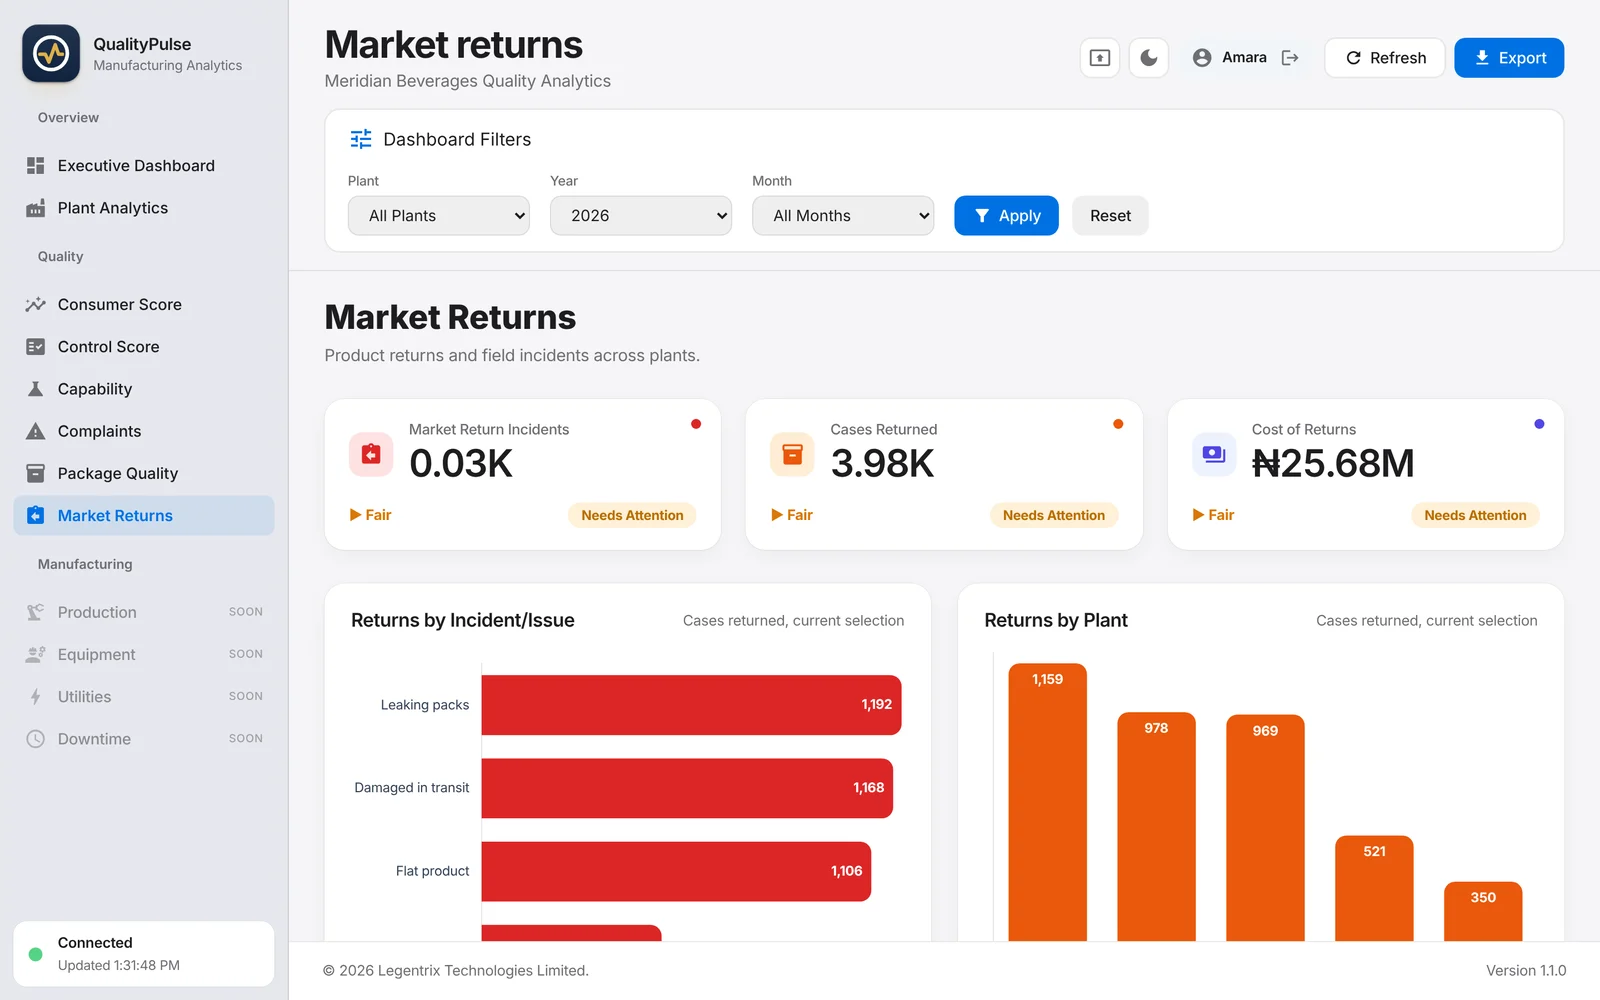
These are screenshots of the product itself, not mock-ups. The plants and figures belong to a fictional company, Meridian Beverages.
Want to click around yourself?
Ask for the interactive demo and we will send you a personal link. It runs on the same sample data, so you can open every panel and try every filter.
A worked example
Follow one issue from alert to action.
Real screens from the product, on the sample data of a fictional beverage group. This is how a quality manager moves from a red flag to a plant-level answer.
-
The dashboard raises the flag
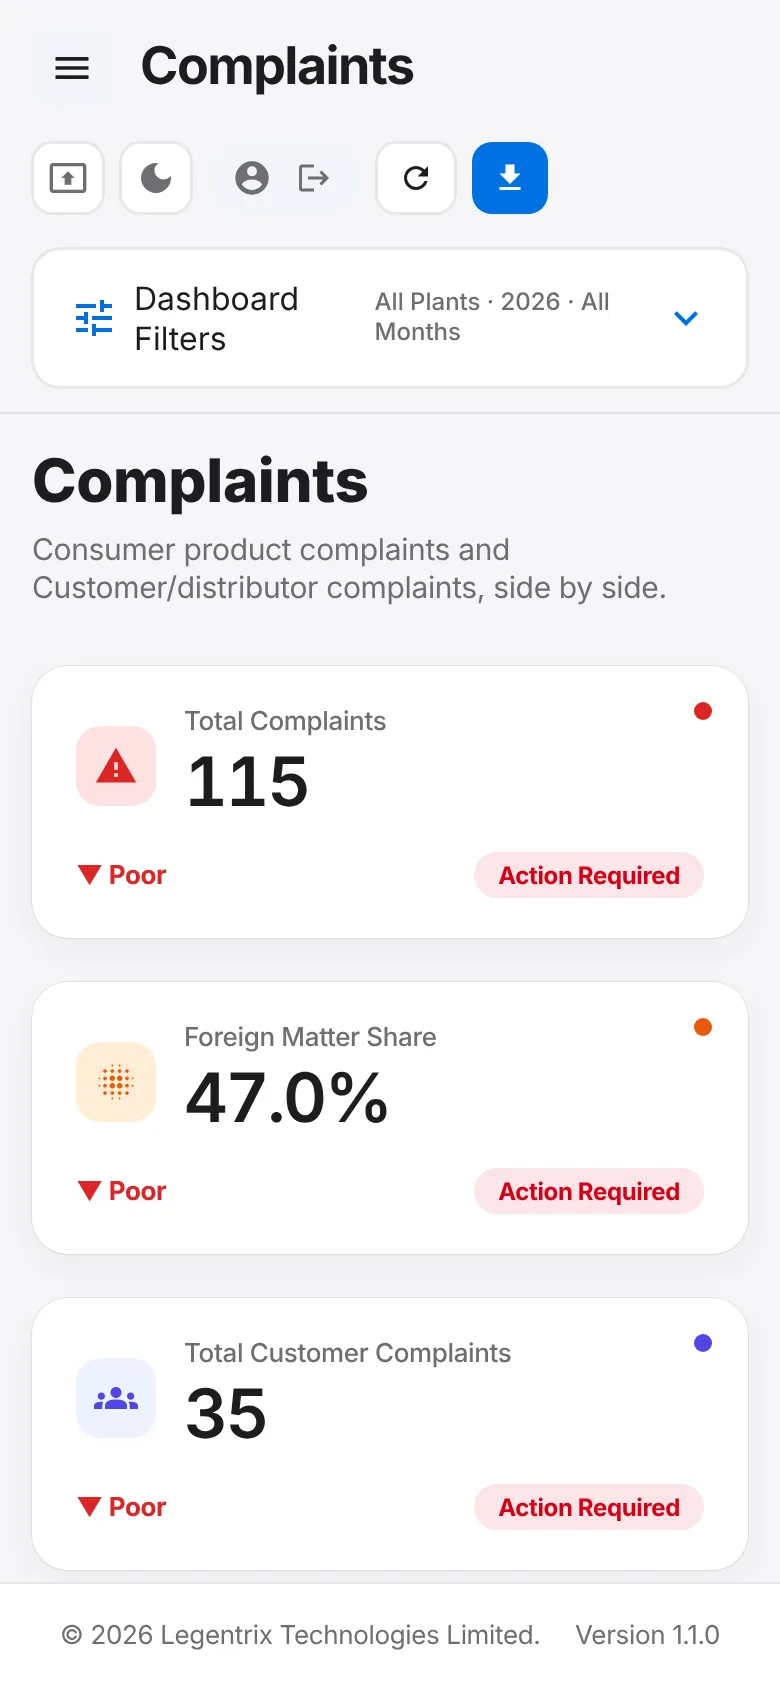
Complaints are marked Poor and Action Required, next to the scores that are fine. You see the problem without opening a report.

-
It names the biggest driver
Foreign matter accounts for 47% of complaints, 54 of 115. The question for the quality meeting is now specific.

-
See the size and the response
Total complaints, the foreign-matter share, customer complaints and the resolution rate (74.3% on this sample data) sit together, so you see how well the team is closing them.

-
Drill into one plant
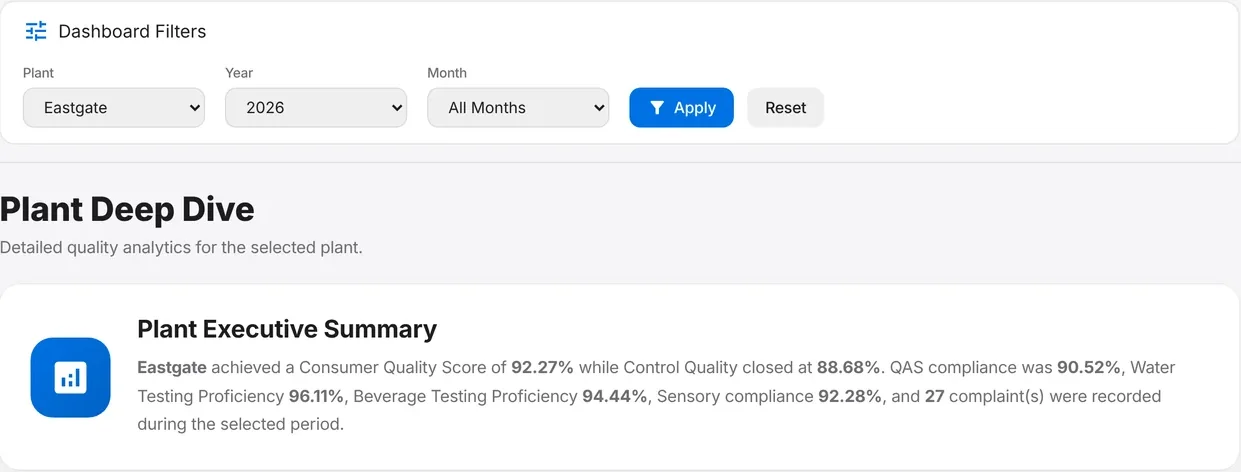
Pick a plant and the same view rebuilds for it, with a written plant summary generated from the numbers.
-
Check the fix is closing
CAPA closure rate sits on the same screen, flagged Needs Attention at 89.5%, so corrective actions do not go quiet.

See it with your own numbers.
Tell us where your complaints and corrective actions live today, and we will show you the same walk-through on your plants.
Light for the office, dark for the control room.
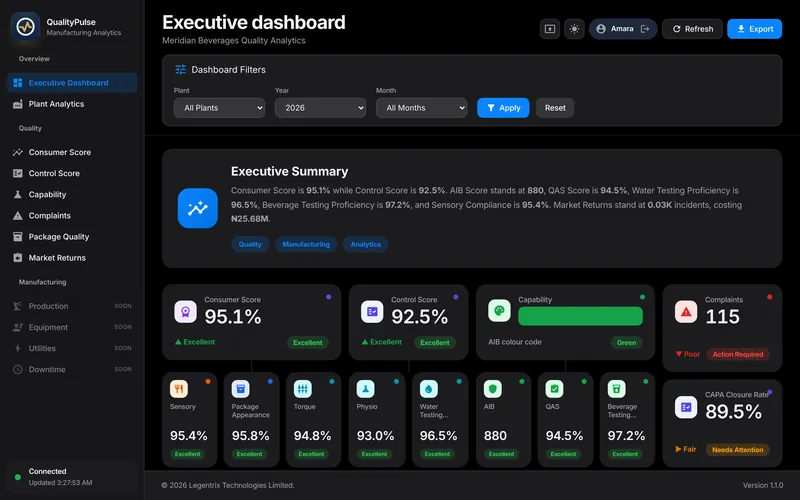
The same dashboard in both themes. Drag the handle, or use the arrow keys, to compare.
On the plant floor, from a phone.
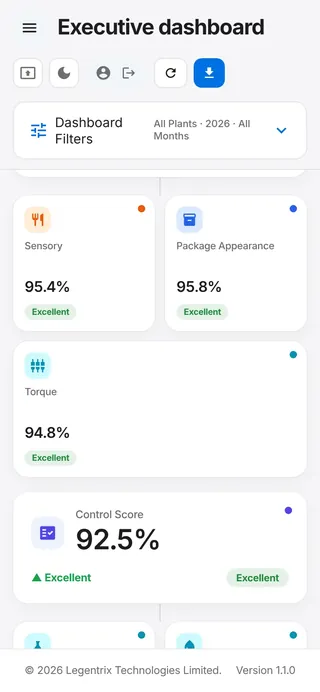
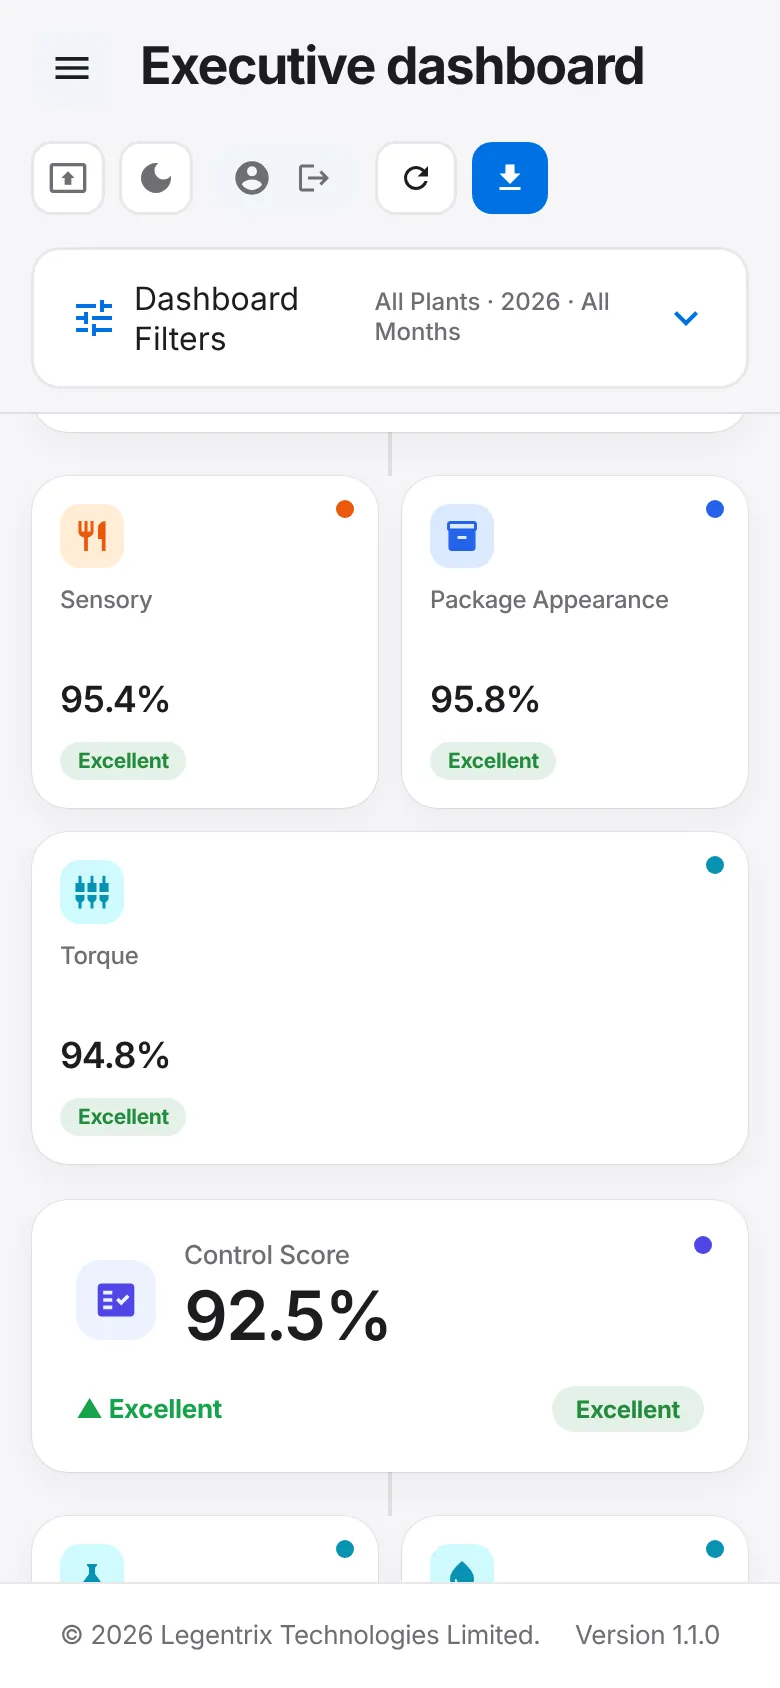
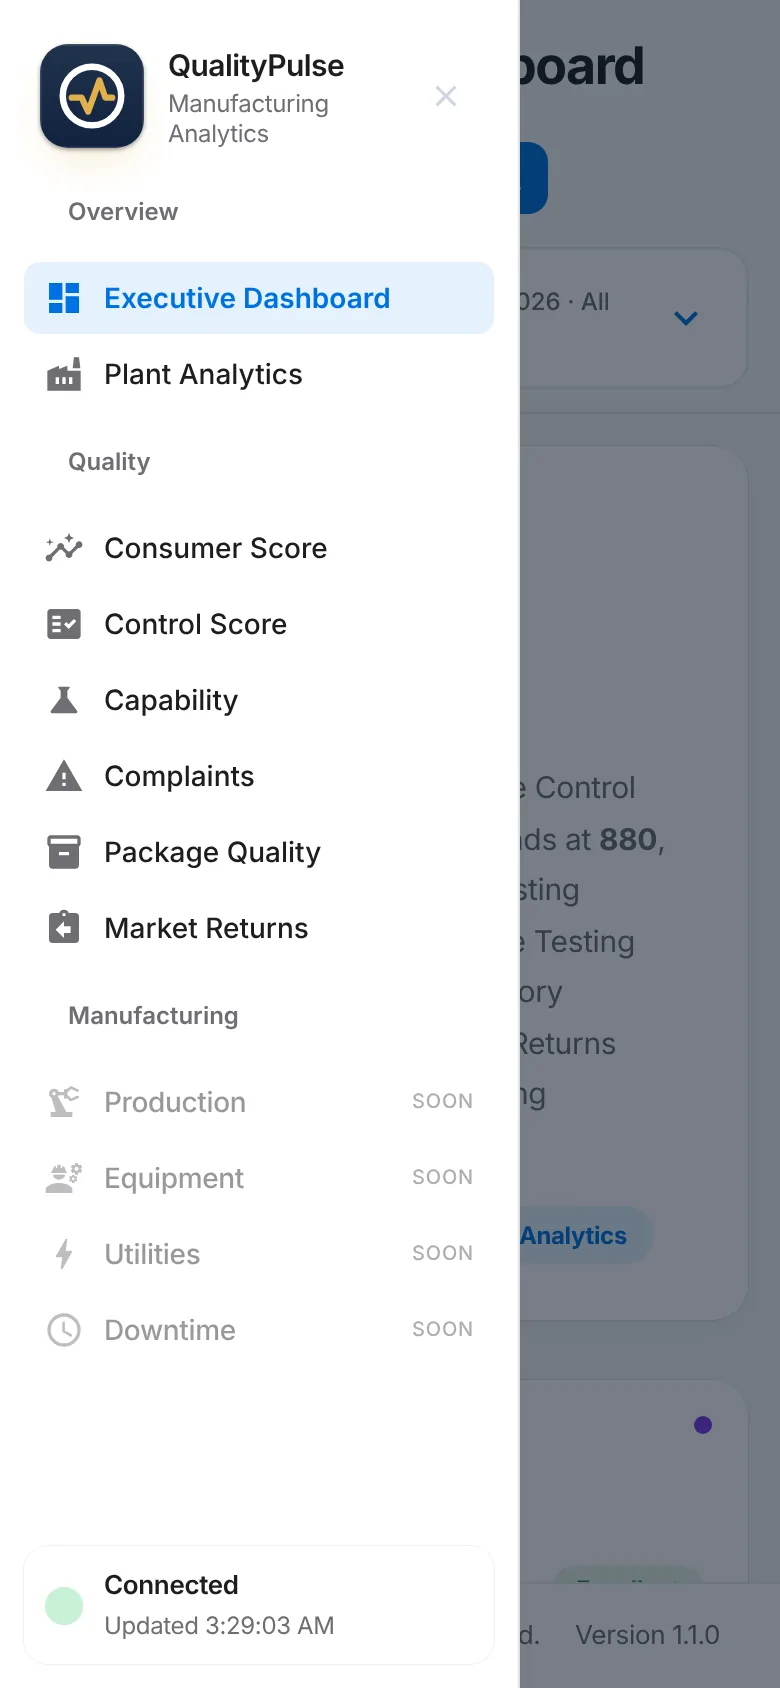
QualityPulse is a web application, so there is nothing to install. These are the real screens in a phone browser, with the same sample data.
What QualityPulse does today.
Every capability listed here is built and in use with a real quality team. Anything still on the roadmap is labelled as such.
Quality scorecards
Consumer and control scores for every plant over rolling windows, ranked so the plant that needs help is always at the top.
Plant analytics
Compare plants on the same scale and see how each one is trending against its target, week by week.
CAPA tracking
Corrective and preventive actions with an owner and a due date, so overdue work surfaces on its own.
Complaints and market returns
Complaint and return volumes by product and plant. Customer contact details are stored apart from quality data.
Packaging and physical checks
Package appearance and physical parameter results roll up from the line into the same plant view.
Sync alerts
If a data sync fails, a named person gets an email with the reason. No quietly stale numbers.
How much time goes into your quality reports?
Put in your own numbers. The result is the time your team spends assembling reports by hand each year, before anyone acts on them.
hours a year spent preparing reports, or about 156 eight-hour working days.
Measure it properly in a pilotThis is an estimate from your own inputs, not a promise of savings. A pilot measures the real figure for your team before and after.
Live without ripping anything out.
Your people keep filling in the sheets and forms they know. QualityPulse reads from them and does the rest.
Connect what you already use
We link QualityPulse to your existing Google Sheets and forms. Nothing to install on the factory floor.
Match your own definitions
Your scoring rules, your targets, your plant names. The numbers on screen match the ones in your reports.
Pilot one plant, then roll out
Start with a single site, check every figure against your records, then switch on the rest when you are confident.
Tell us what you are trying to fix.
Book a demo, request a pilot or describe the system you need. A real person reads every message and replies personally.
Message sent.
Thank you. We have your message and will reply to the email you gave us. A copy is on its way to your inbox. Your personal link to the interactive demo is in your inbox too.
Pick a time for your demo